Home

The Svalbard radar interpretation experiment

How to use the website

Please read the instructions thoroughly before starting!

Thank you for participating in this experiment. Its purpose is to evaluate the subjective nature of interpreting radargrams of glaciers. Therefore, this instruction set is as limited as possible, to avoid the transfer of subjective biases!

How to become a contributor

We welcome any contributor with basic background in radar interpretation. You do not need to be an expert at all, but some understanding of what we work with is expected! We plan on accepting contributions until late 2025. To register, please send an email to svalbardradar@gmail.com with "Contribution request" in the title, and briefly explain your experience in just a sentence or two. Your contribution is anonymous to all except the contribution administrator (behind the email), who is not part of designing the experiment.

What we want

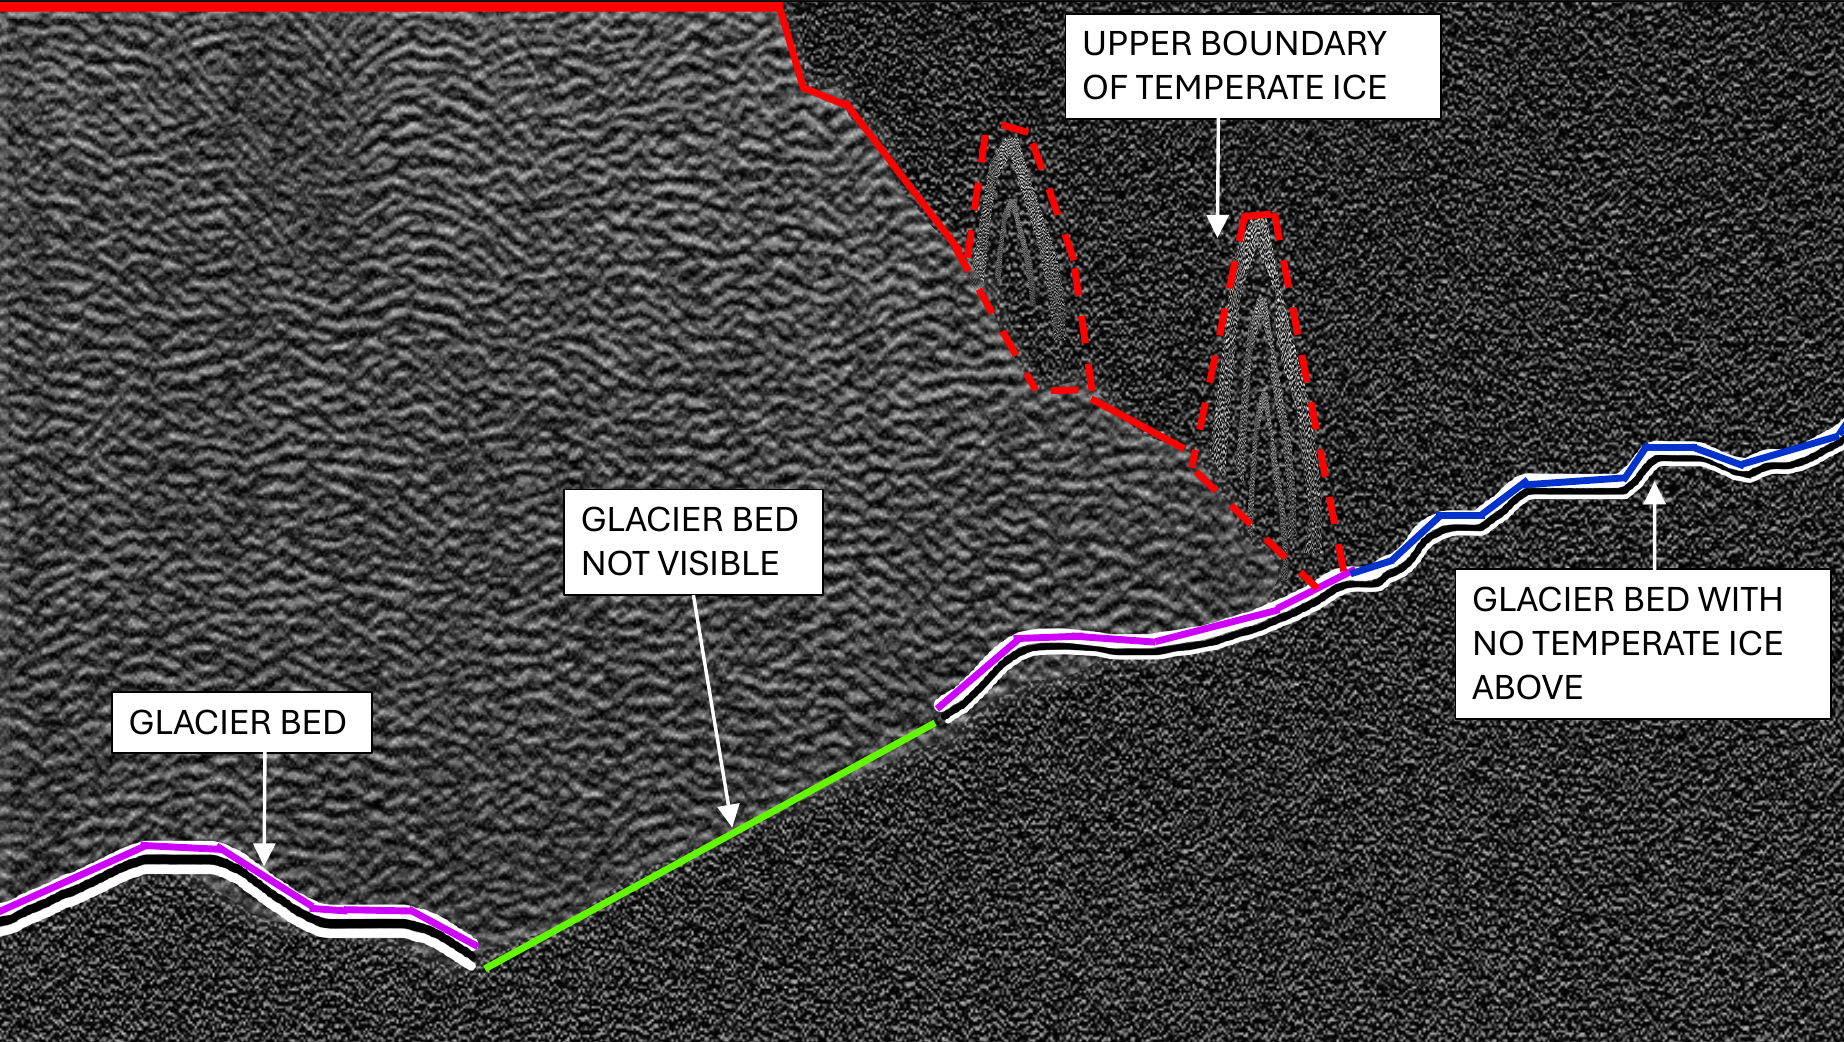
We want to extract two things: the cold/warm transition (temperate ice) and the glacier bed. How? By drawing lines to mark boundaries for the cold/warm ice interface, or the ice/bed interface. There are of course many other features within these radargrams, such as englacial channels and debris. The study is currently not aimed to these features, but comments can be added for features of interest. The amount of time spent is up to the contributors. Interpreting a few radargrams is helpful, but the more you can interpret, the better!

How it might look like

The illustration shows how interpretations may end up looking like. We do not want to show how we would interpret a real radargram because it would defeat the point of the experiment!

  • Temperate ice marks the upper boundary of the temperate ice. The dashed lines show two possible interpretations; which one is up to you!
  • Glacier bed is wherever we see the bed and we may/do have temperate ice above.
  • Glacier bed (no temperate ice) assumes no temperate ice above.
  • Glacier bed not visible is when the bed is not visible at all, not just unclear. The depth (y) coordinates do not matter, only the trace (x).

  • What to look for (1/4)

    Glacier bed (no temperate ice)

    The arguably easiest thing to look for is the bed of a glacier without temperate ice. As seen in the picture, there is a quite sharp line with relatively clean ice above. Note that this class simply means no temperate ice is above the bed, but we cannot truly tell whether a warm basal layer exists from just looking at the data. Also in the picture, there are some englacial features (thrust features perhaps) which we don't focus on in this experiment.

    If we don't want to assume that the bed is overlain by only cold ice, we can instead use the safer Glacier bed class to delineate it.

    What to look for (2/4)

    Temperate ice

    Temperate ice (ice with water in it) shows up as very noisy data in an almost raincloud-like effect. We want to map the upper boundary of this. From the picture, it is probably immediately evident how subjective mapping the boundary is. That's the point of the experiment! Make sure to map the upper boundary even when the temperate ice reaches the top of the radargram. Otherwise, the data (temperate/cold) will be inconclusive. Remember to "finish" the line; start and end the line at the bed (unless temperate ice continues beyond the extent of the radargram).

    We use the Glacier bed class to delineate the bed under the temperate ice.

    What to look for (3/4)

    Glacier bed

    We often see the glacier bed with scattering above it. This means that we might have temperate ice above the bed. If you're ever unsure, just use this bed class instead of the cold-assuming one!

    In the picture, we see scattering indicative of temperate ice, which would deserve its own Temperate ice delineation. Underneath is a clear bed reflection, which would be a generic glacier bed.

    The vertical stripes are artefacts of crevasses that we drove over (oops!).

    What to look for (4/4)

    Glacier bed not visible

    In some cases, the bed is simply not visible. Either it's because the bed is deeper down than the radar is set-up to observe, or because there is so much temperate ice that it completely hides the bed. In that case, there is a special class to signify that the bed is invisible. It is added as a normal line, but the depth does not matter (only the x-coordinate is read).

    In the picture below, the bed seems to be clear only in the middle of the radargram. Therefore, a Glacier bed or Glacier bed (no temperate ice) could be added where it is visible. Every other part can be flagged as not visible. The upper Temperate ice boundary should be added too!

    How to add interpretations

    Interpretations are added as lines. The starting point, endpoint and everything in between counts, so take care!

    - 1: Interpretations are added in the radargram toolbar. The icons below are for editing/deleting lines.

    - 2: They are assigned whatever color/class that is chosen above. You can always click on an added line and change its class or to split it.

    - 3: The display style of the radargram can be chosen; Absolute (absolute values) suits most needs, but the classic view has more fine-grained detail.

    Please be brave; map a line even if you're a bit unsure! The ensemble spread will tell if what you mapped out was uncertain.

    Please avoid overhangs; During evaluation, the line y-coordinate will be evaluated as y(x). If multiple y's exist for the same x (i.e. a line that passes over itself), there will be trouble (for us).

    Saving/loading

    It is possible to save and load progress with the associated buttons. Saving means downloading the progress as a file, which can be imported again. Nothing is saved on the server or your browser, so saving is important!

    Submitting

    When finished, submit the interpretations with the submit button. We will only use the last submission in case you submit multiple times.

    How the data are aggregated

    Once we have all interpretations, we will use this as an ensemble dataset to aggregate into one line (one for temperate ice and one for the bed) with a spread. How this will be done exactly is still being designed, but it will most likely include Gaussian Process Regression. Each user's contribution will be weighed against their relative agreement with the others; a consistent user will be given a large certainty flag, while an inconsistent user will be more uncertain. Note that we cannot assess absolute accuracy, only relative consistency! Therefore, your contribution might be the most correct (even if it's not consistent with the others'), but there is no way for us to tell.

    Final notes on the radargrams

  • All data are batch-processed with the same settings. Some data will look great and some mediocre. If they look really bad, a comment about it is appreciated!
  • Migration has not been applied, both to better identify temperate ice, and because the GPS data are sometimes quite bad.
  • Horizontal resampling (equidistant traces) has also not been applied due to the sometimes bad GPS data. Therefore, a few standstills exist in the data.